ITR Atlas: Comparing Information Transfer Rates Across Interfaces
Published:
Information transfer rate (ITR) and throughput are widely used throughout HCI and BCI to summarize how quickly a person can communicate with or control a system. Expressing performance in bits per second appears to provide a common basis for comparing interfaces as different as a mouse, a gaze keyboard, and an intracortical speech decoder. However, these comparisons depend strongly on how the bits are defined and which assumptions the calculation makes. I built ITR Atlas after encountering a chart of invasive BCI performance and finding that the underlying scores were difficult to audit on a consistent basis.
Different scoring methods answer different questions. The Wolpaw formula treats an interface as a selection from a fixed set of commands. Nuyujukian’s achieved bitrate similarly credits correct selections according to the size of the available target set. Fitts’ law measures the difficulty of continuous pointing from target distance and width, while Shannon entropy can bound the information carried by language. Each method can be appropriate, but applying them to the same interface can produce very different scores.
For ITR Atlas, I returned to the original source for each interface and re-derived its score from the reported task, timing, accuracy, and action space. Every entry shows the source values and arithmetic step by step. It also distinguishes results that were reported and reproduced from those that had to be recomputed because the original paper did not provide a comparable ITR.
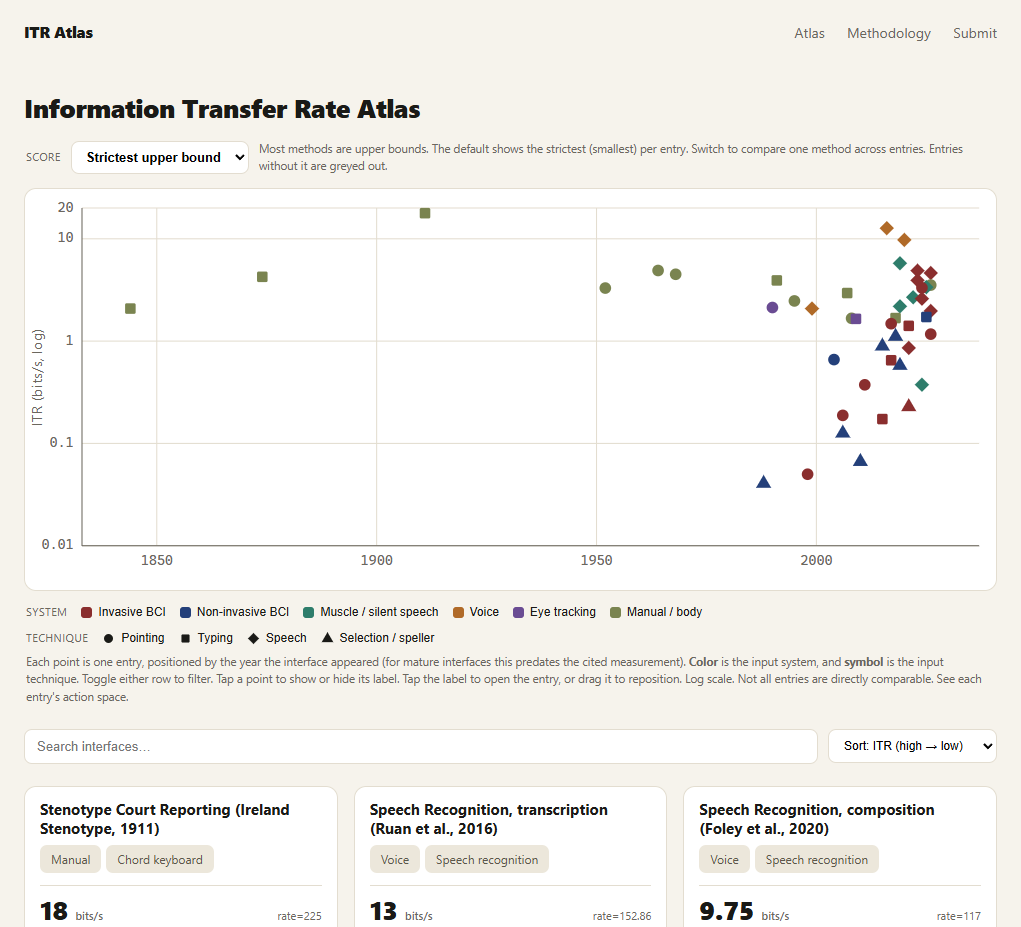
The Atlas compares interfaces over time on a logarithmic scale. Color identifies the input system, while symbol identifies the interaction technique.
Rather than choosing one formula for every interface, the Atlas treats each applicable estimate as an upper bound and uses the strictest, or smallest, valid bound as the default score. Alternative calculations remain visible on each entry and through the score selector. This makes it possible to inspect both the comparison and the assumptions behind it.
Observations from the current Atlas
Grid size can outgrow human pointing capacity
Cursor-controlled BCI benchmarks often use grids of possible targets. Wolpaw and Nuyujukian-style formulas credit each grid cell as a separate command, so enlarging the grid increases the information assigned to every correct selection. In a point-and-click task, however, the target is shown before the movement. The user is not choosing freely among every cell; they are moving a cursor to one cued location. Fitts’ law provides a tighter bound based on the distance, target size, movement time, and accuracy. As these grids become denser, human visual and motor limits matter more than the nominal number of cells.
Point-and-click throughput begins to converge across modalities
Using a Fitts-style bound lowers several recent cursor-BCI scores relative to their reported grid-based figures. Neuralink PRIME’s 8.01 BPS Webgrid result becomes 3.32 bits/s, while the 3.7 bits/s BrainGate2 ReFIT result becomes 1.48 bits/s. Augmental’s MouthPad independently reports a Fitts throughput of 3.53 bits/s. Despite using very different sensing modalities, Neuralink PRIME and MouthPad fall in a similar range and both exceed the current gaze-pointing and gaze-dwell entries. The current data suggest a practical region in which point-and-click throughput starts to flatten across modalities, although more comparable measurements are needed before treating it as a fixed ceiling.
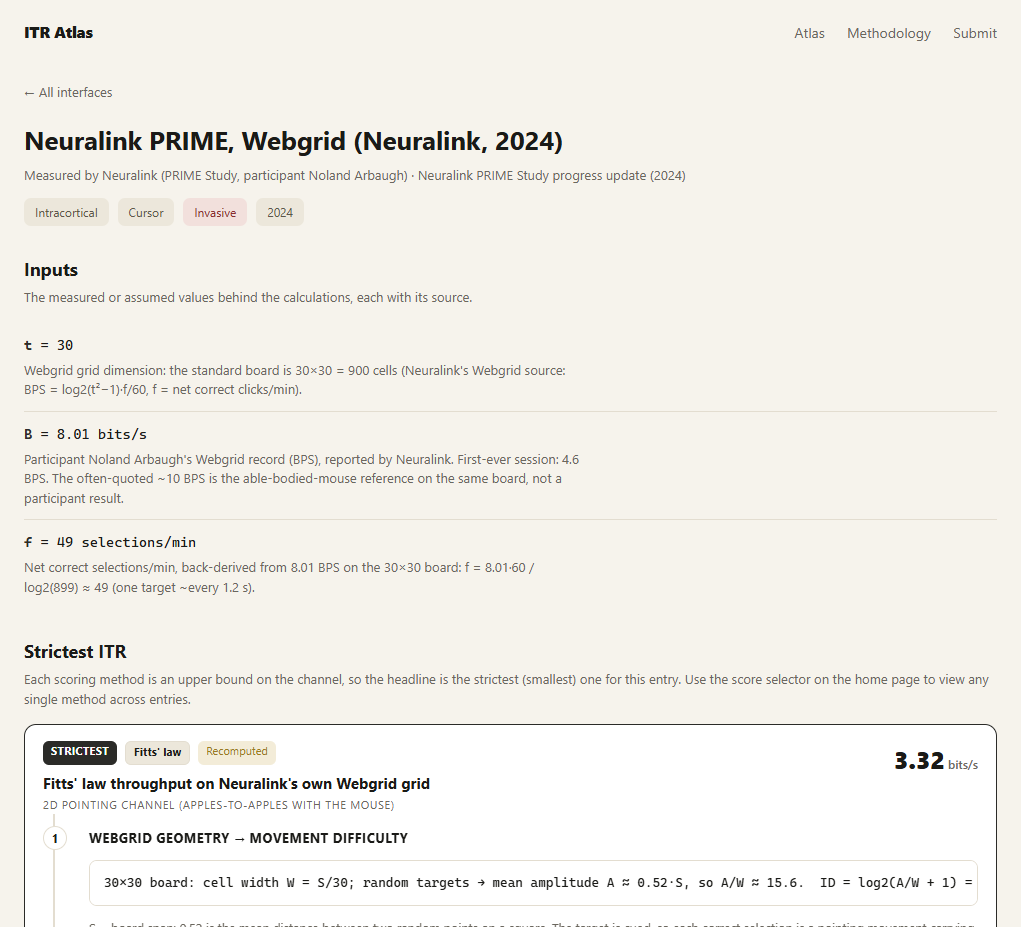
The Neuralink PRIME entry re-credits the reported 8.01 BPS Webgrid score using the movement difficulty of its cued targets, producing a Fitts-style estimate of 3.32 bits/s.
Speech remains the highest-bandwidth BCI pathway
Speech BCIs generally appear above cursor and speller BCIs when the Atlas uses its strictest estimates. For language-producing systems, Shannon’s language entropy is usually a tighter bound than treating every character or word as an equally likely command. For example, the Willett et al. intracortical speech BCI decoded attempted speech at 62 words per minute with a 23.8% word error rate. Its large-vocabulary Wolpaw estimate is approximately 12.5 bits/s, but the information carried by the resulting English is closer to 3.93 bits/s under the shared language-entropy bound. Speech BCIs and silent-speech interfaces still trail modern speech recognition, which reaches approximately 13 bits/s in the current Atlas.
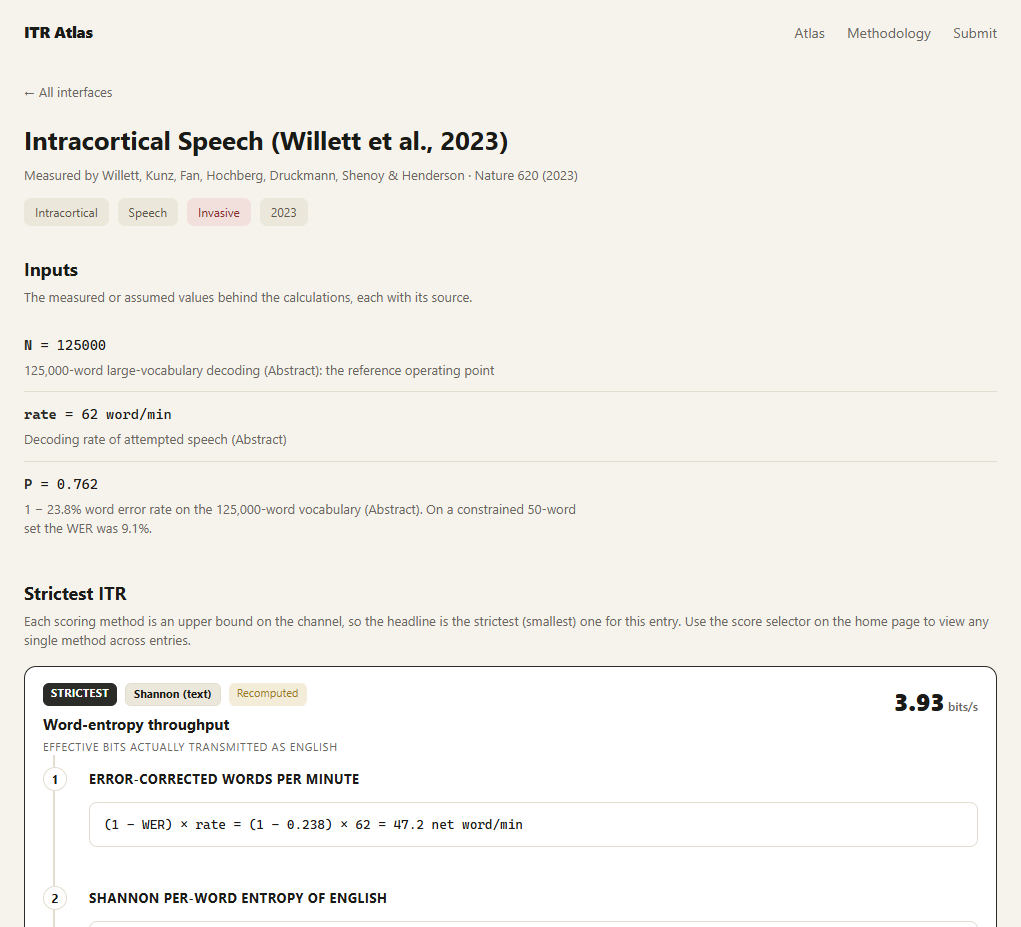
The speech-BCI entry applies the same language-entropy convention used for keyboards, eye typing, silent speech, and conventional speech recognition.
Invasive BCI progress currently looks approximately exponential
On the Atlas’s logarithmic scale, the invasive BCI entries form a surprisingly linear upward trend over time. Read literally, that would imply approximately exponential progress in information throughput. I treat this as a tentative observation rather than a fitted result: the dataset is curated, the tasks are heterogeneous, and additional systems may change the pattern. It will be interesting to see whether the trend remains as the Atlas grows.
The Atlas is not intended to decide which interface is best. Bandwidth is only one part of an interface alongside accessibility, invasiveness, fatigue, training, robustness, privacy, and the task itself. The narrower goal is to make throughput comparisons inspectable: if a number supports a claim, readers should be able to see where it came from and which assumptions make it possible.
The website and source code are public. Corrections to existing scores, suggestions for additional metrics, and source papers for interfaces that should be added are all welcome.